web synth docs
spectrum visualization
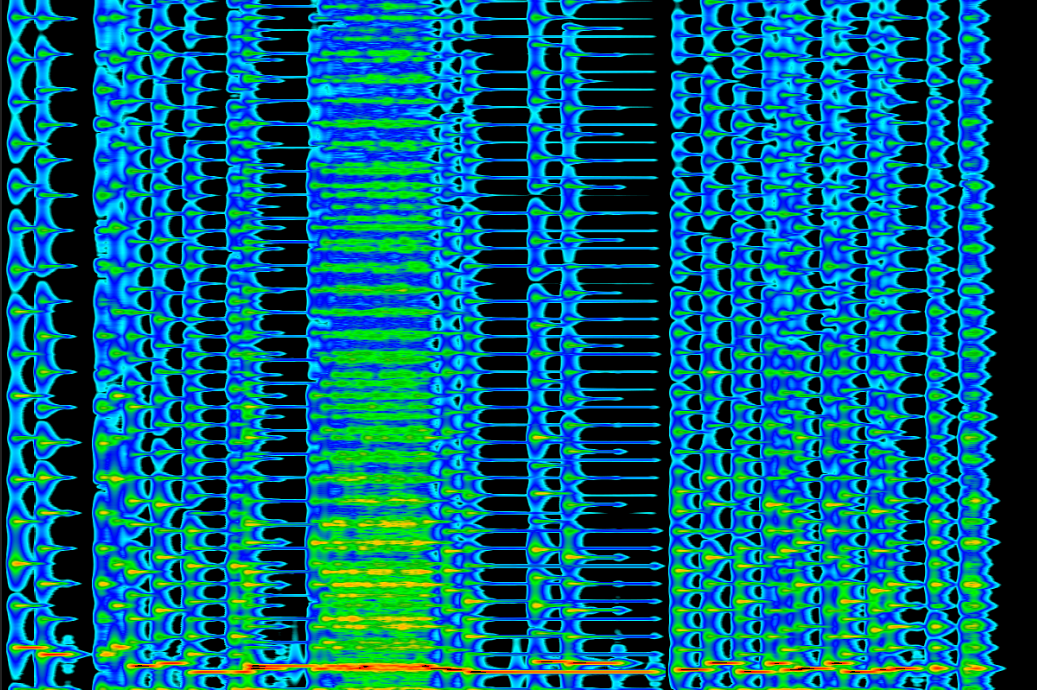
Web synth has a built-in spectrum visualization that shows the audio spectrum of sound. One is currently included in the [fm-synth], the [synth-designer], and then [code-editor]. It is produced by taking the outputs of the [web-audio] AnalyserNode which correspond to the outputs of a fast fourier transform and plotting them over time. Lower frequencies are at the bottom, and higher frequencies are towards the top.
config
There are two config options currently available: value scaler function (scaler_fn) and colorizer function (color_fn)
value scaler function
This config option determines what method is used to map values to intensities that are then translated into colors using the colorizer function. Linear takes the outputs of the FFT used as input and passes them through. If Exponential is selected, the highest values are exaggerated and lower values are filtered out which helps with noisy spectrograms.
colorizer function
The colorizer takes the outputs of the value scaler function and maps them to RGB values which are then plotted. There are several built-in color schemes available, and I highly recommend checking out "radar" which is based off of the color scheme used by weather radar maps to show the intensity of percipitation.